Using a support vector machine to classify workdays
I use the same data set as in my last post which is a list of days (weekday, day of the month, month) from the last years labeled with 1 or 0 depending on whether I went to work on that particular day or not.
Objective: Train a model that can discriminate weekdays from days of the weekend (see the last post for more details).
Support Vector Machine
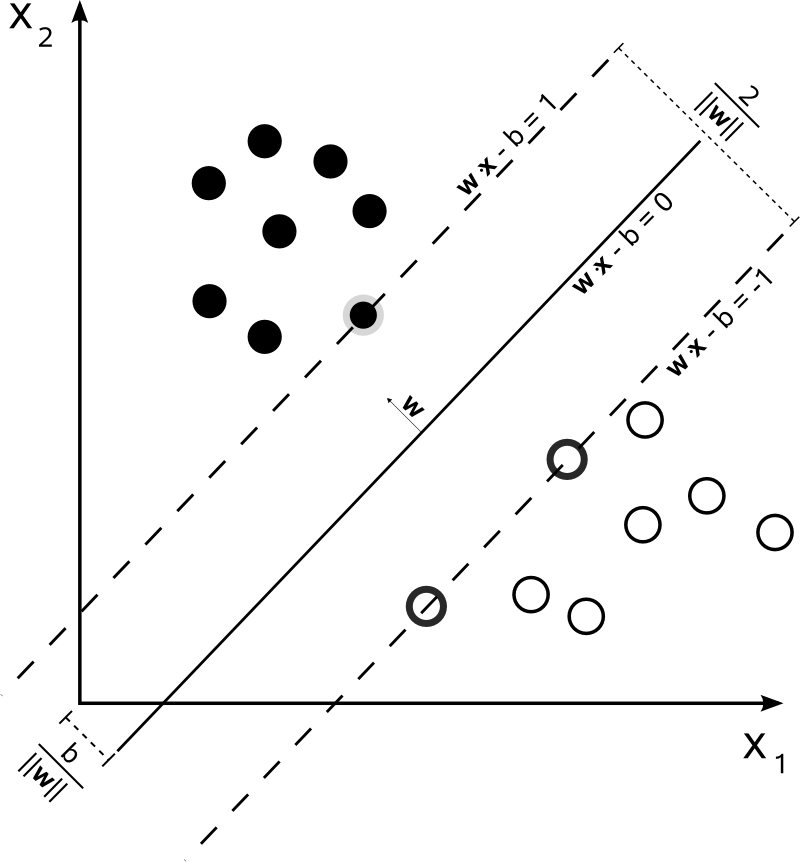
If you want to classify the data points in this image you can draw a line which defines a border. All the points on one side belong to one class and vice versa. In above image only the “important” points have a thick border. They are called the support vectors.
The intuition behind the support vector machine is to fit the line (decision boundary) with the greatest distance to all support vectors.
The data
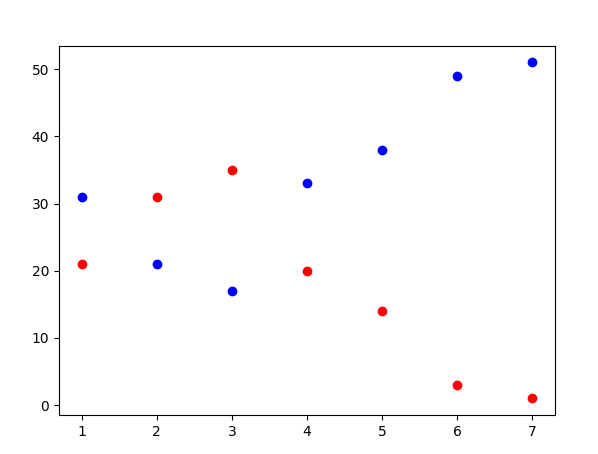
This plot show the weekdays on the x-axis in relation to the work days (red) and non-work days (blue). It is already visible that the two classes cannot be differentiated well on weekdays.
Training
We use svm from scikit-learn. (See http://scikit-learn.org/stable/auto_examples/svm/plot_iris.html)
from sklearn import svm
from sklearn.metrics import accuracy_score

X, y = get_training_data()
X_test, y_test = get_test_data()

models = (svm.SVC(kernel='linear'),
          svm.LinearSVC(),
          svm.SVC(kernel='rbf', gamma=0.7),
          svm.SVC(kernel='poly', degree=3))
models = (clf.fit(X, y) for clf in models)

scores = (accuracy_score(y_test, clf.predict(X_test)) for clf in models)
Now we have got four different models.
Let’s visualize them:
titles = ('SVC with linear kernel',
          'LinearSVC (linear kernel)',
          'SVC with RBF kernel',
          'SVC with polynomial (degree 3) kernel')

# Set-up 2x2 grid for plotting.
fig, sub = plt.subplots(2, 2)
plt.subplots_adjust(wspace=0.4, hspace=0.4)

X0, X1 = X[:, 0], X[:, 1]
xx, yy = make_meshgrid(X0, X1)

for clf, title, ax, score in zip(models, titles, sub.flatten(), scores):
    plot_contours(ax, clf, xx, yy,
                  cmap=plt.cm.coolwarm, alpha=0.8)
    ax.scatter(X0, X1, c=y, cmap=plt.cm.coolwarm, s=20, edgecolors='k')
    ax.set_xlim(xx.min(), xx.max())
    ax.set_ylim(yy.min(), yy.max())
    ax.set_xlabel('Days of the week')
    ax.set_ylabel('Day of the month')
    ax.set_xticks(())
    ax.set_yticks(())
    ax.set_title(title + " accuracy={}".format(score))

plt.show()
Running the training and cross validation with a total of ~250 rows already takes four minutes on my average laptop.
Evaluation
The result looks really interesting (the labeling of the axes should be the other way around):
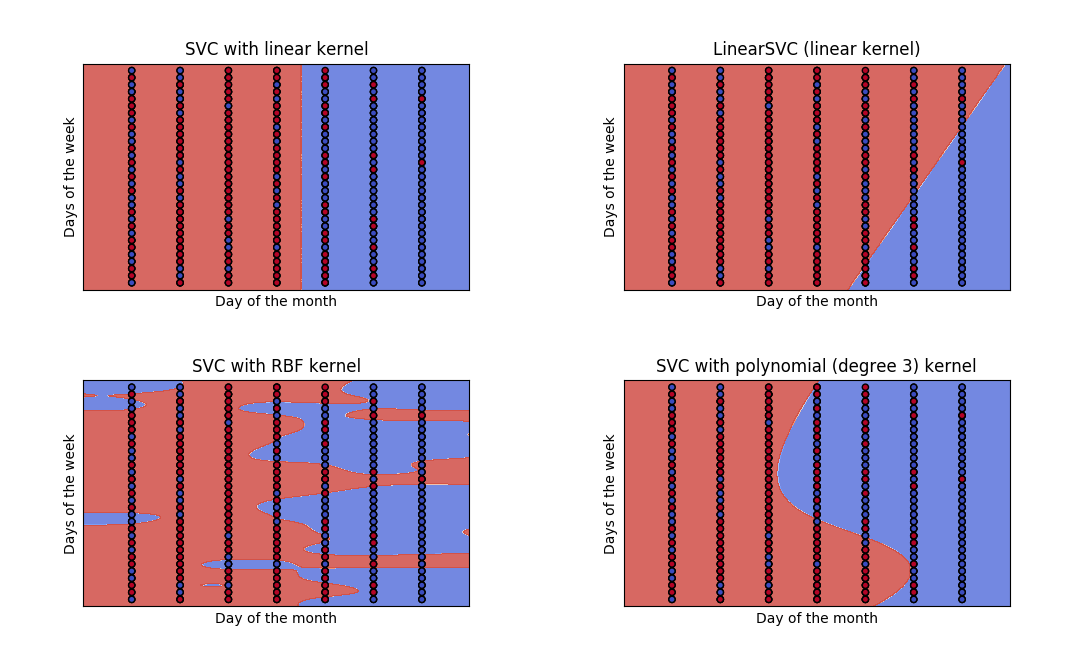
The SVC with linear kernel has an accuracy_score of 74% => error: 26%
The linear kernel produces a line that perfectly separates monday-friday from saturday and sunday. Using this svm would be enough to solve the objective.
The radial based function kernel (RBF) does an incredible good job fitting the small clusters in the data but I guess that these patterns won’t occur in the test data.
Train and evaluate again
I don’t expect there to be a correlation between day of the month and the weekday. Maybe there is one between month and day of the week.
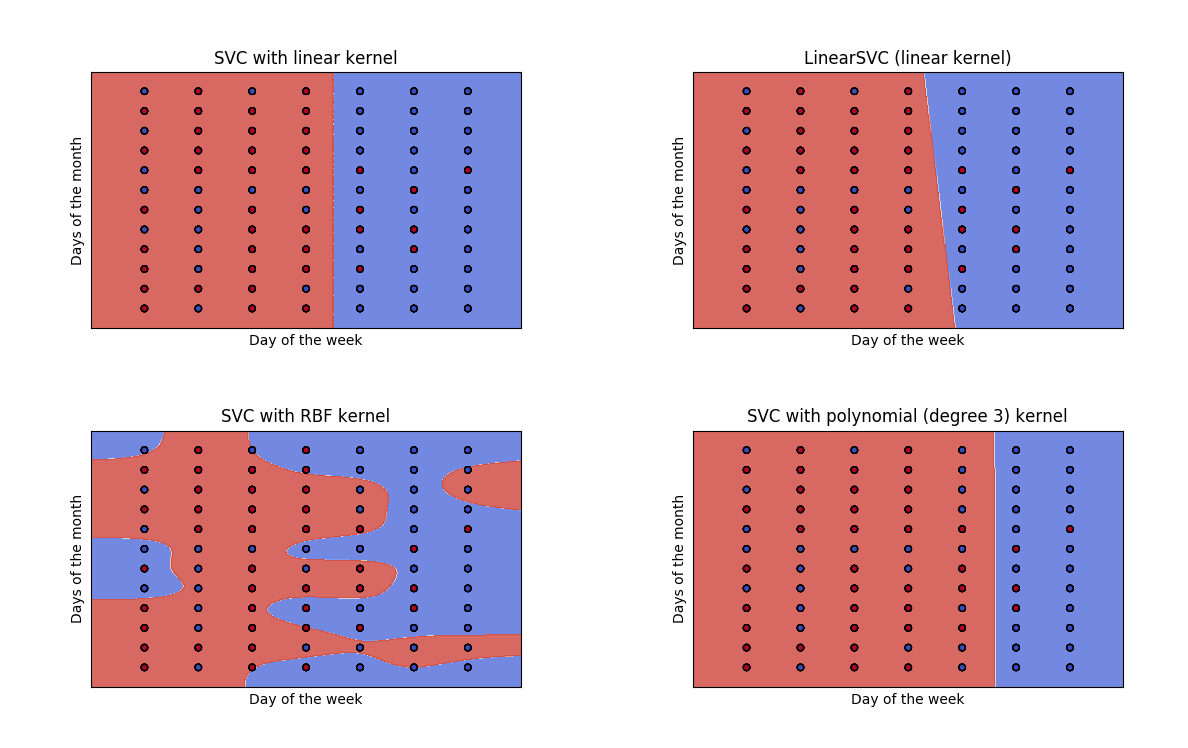
Now three support vector classifiers achieve to draw a good decision line for the weekend which results in a good score for an artifical weekend data set. But the errors for the normal test data set is higher than before.
Last try
The last possible correlation we could explore is day of the month and month.
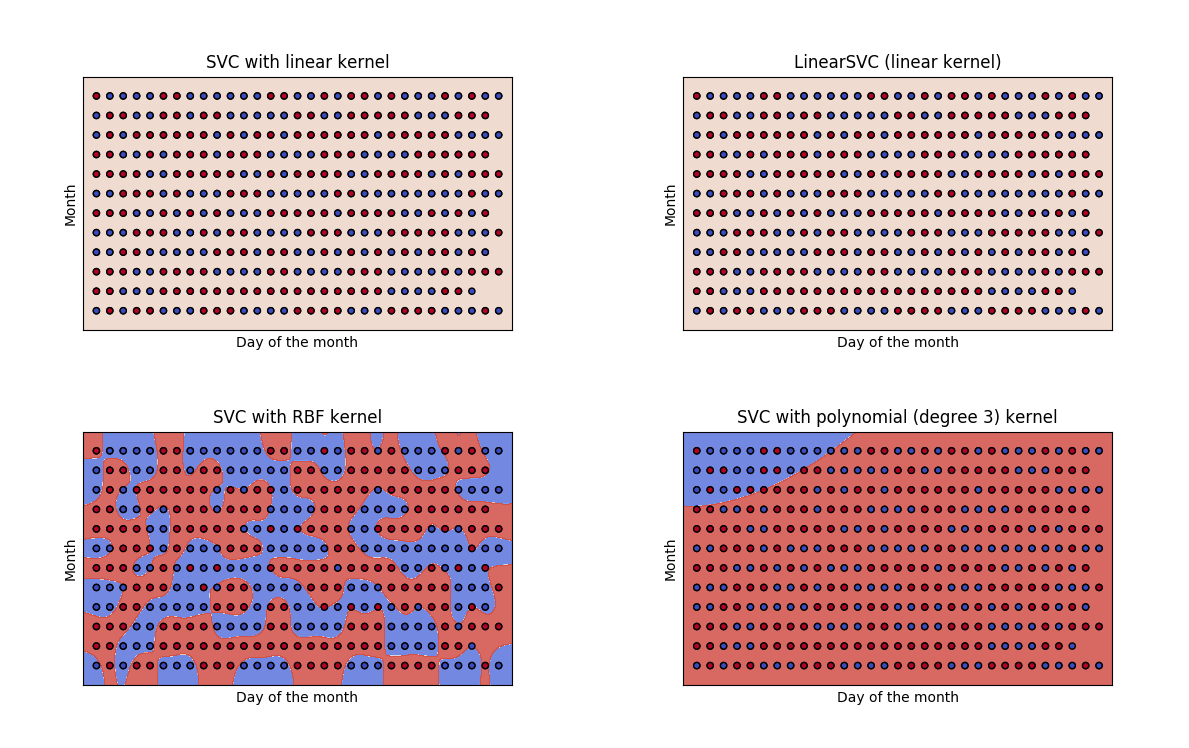
Three of the classifiers fail to find a decision boundary but the support vector classifier with radial based function kernel outputs an interesting carmouflage pattern which performs as good as the weekend boundary found by the svc with linear kernel (SVC with RBF kernel 0.7530864197530864).